
India’s highway numbers make a compelling first impression. NHAI has reduced its borrowing burden while continuing a large construction programme. National Highways Infra Trust, or NHIT, has expanded its concession portfolio and distributions. Cameras, survey vehicles and drones are making the underlying roads more observable.
There is plenty here to catch the eye. NHAI reports 5,313 km constructed in FY2026, alongside ₹2,44,362 crore of administrative capital expenditure. NHIT’s audited consolidated operating revenue reached ₹4,274.07 crore, up 80.81%, and its fiscal distribution rose to ₹11.329 per unit. Together, these figures give us a reason to look more closely at how India funds new roads and finances the ones already operating. NHAI performance release; NHIT annual report, PDF pp97 and 161–162
Each achievement has its own explanation. Paying down authority debt, adding concessions and increasing cash distributed per unit are different steps in the journey. Following the money through them brings the more interesting question into view: how well does the financing system turn the roads it acquires into lasting cash for the people who fund it?
My reading is that India is developing a more capable system for recycling highway capital. Its next test is demonstrating durable cash generation from the same roads, after financing and lifetime maintenance. To understand that progress, I start with the funding, follow it into the trust and then return to the condition of the roads. Better monitoring could help connect all three.
First Follow the Rupee Through the Entities
Before opening the balance sheets, it helps to know who holds what. NHAI is a statutory public authority. NHIT is a separate investment trust sponsored by NHAI. NHIT’s controlled project companies hold defined-duration concessions and collect the associated road revenues. Keeping those boundaries in view makes the flow of money much easier to follow.
The financing chain is straightforward. Investors and external lenders supply NHIT with capital. The trust finances its project companies through equity and shareholder loans. The project companies pay concession fees, collect tolls and eligible compensation, maintain the roads and send eligible cash upstream. The trust meets its own financing obligations and distributes available cash to unit holders. NHAI can recycle concession proceeds into its development and funding programme. NHIT annual report, PDF pp16–17, 138–139, 141 and 187–192
That chain also explains an easy accounting trap. A shareholder loan appears as an asset in the trust and a liability in the project company. It disappears on consolidation. Adding those internal loans to the group’s external borrowing would count the same financing relationship twice.
The appeal of capital recycling becomes clearer when we follow the money through time. An upfront concession payment turns a specified future revenue stream, together with operating obligations, into money available today. That can fund useful new infrastructure. The years ahead still have to justify the price paid, the risks taken and the work required to maintain the road. Monetisation receipts alone cannot tell us whether the transaction creates value.
1. NHAI’s Debt Improvement Starts with the Funding Model
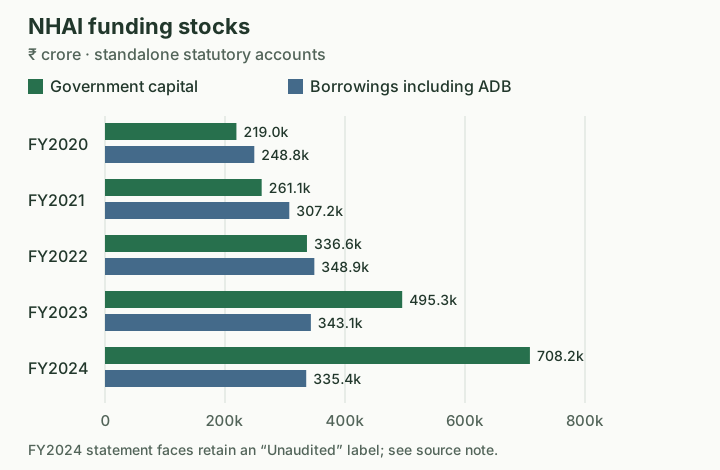
Start with NHAI, where the funding mix gives the debt story its shape. The historical accounts show the build-up of borrowing alongside government capital. Keeping both on the same statutory accounting basis lets us see how that relationship changed.
| Financial year-end | Government capital | Borrowings including ADB |
|---|---|---|
| FY2020 | 2,19,026.69 | 2,48,831.66 |
| FY2021 | 2,61,113.53 | 3,07,162.61 |
| FY2022 | 3,36,595.88 | 3,48,907.24 |
| FY2023 | 4,95,321.32 | 3,43,114.24 |
| FY2024 | 7,08,177.58 | 3,35,373.20 |
Scroll horizontally to read all columns.
₹ crore; NHAI standalone statutory accounts. Government capital excludes the separately reported capital-grant balance. These are stocks at year-end. Annual reports contain CAG observations; the FY2024 statement faces retain an “Unaudited” label. Sources: FY2020, PDF p61; FY2022 with FY2021 comparator, PDF p91; FY2023, PDF p87; FY2024, PDF pp84–85.
The Union Budget’s differently scoped headline series then records debt falling from ₹3,35,173 crore in FY2024 to ₹2,44,539 crore in FY2025, a 27.04% reduction. Its treatment of ADB borrowing and rounding differs from the table, so the two series should remain separately labelled. Expenditure Profile, Statement 27A, PDF p302
For FY2026, the government reports ₹2,38,384 crore of budget support against ₹2,44,362 crore of expenditure: 97.55%, with ₹5,978 crore from own funds. This budget category includes recycled toll and monetisation receipts. It cannot be read as 97.55% fresh taxpayer subsidy. It does show how central public funding has become to the authority’s delivery model. Performance release; funding categories and toll ploughback, FY2024 report, PDF pp29 and 138
This is an encouraging change in the authority’s funding position: road delivery has continued while borrowing has fallen. The funding mix explains why that can happen. The evidence does not establish that faster traffic alone paid down the debt, and declining NHAI standalone debt does not quantify a matching reduction across the entire public sector.
The latest June 2026 filing takes reported debt to ₹1,95,303.71 crore, against ₹14,65,842.55 crore of gross book assets and ₹12,22,119.99 crore of net worth. Debt/assets is therefore 13.32%. Both June and the filing’s restated March comparatives are unaudited, with a limited review. The gross-assets working table is a different presentation from the older sources-and-applications accounts. June filing, PDF pp1 and 4–5
That large asset denominator needs context. The CAG challenged recognition of ₹10,07,532.92 crore of assets held on behalf of the Government of India in the FY2024 accounts. NHAI’s response relied on operational control; a subsequent joint meeting adopted the description “Capital work on Road Assets entrusted to NHAI,” while government ownership remained. This is an accounting-recognition dispute with a documented response and reform process. It limits a corporate-style interpretation of return on assets or “equity value.” NHAI’s government-provided capital is not divided into shares. CAG observations and response, PDF pp74–76, 120–121 and 138–139; June filing, PDF p5
Future commitments also extend beyond borrowing. The FY2027 Receipt Budget lists ₹2,61,510.55 crore of unpaid NHAI/MoRTH annuity liabilities at FY2025-end. These are nominal contractual payments, including future-start projects, rather than a present-value borrowing balance. Adding them mechanically to debt would be wrong; ignoring them would also leave the fiscal picture incomplete. Annuity schedule, PDF pp2, 8 and 17–18
Put these pieces together, and the public-finance question becomes more useful. Can budget support and recycling proceeds sustain construction, maintenance and contractual commitments with less refinancing pressure? The borrowing balance helps answer it, alongside the obligations and funding flows that sit around it.
2. NHIT’s Growth Shows What Capital Recycling Can Build
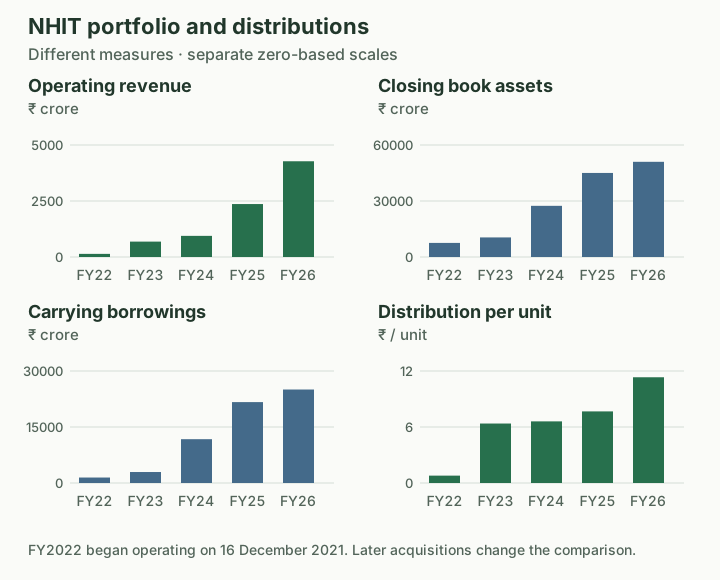
Follow the concession proceeds to the other side of the transaction and NHIT comes into focus. Here, the first achievement is scale: operating concessions have become a larger pool of revenues and cash distributions, financed by both units and external debt.
| Financial year | Operating revenue | Closing book assets | Carrying borrowings | DPU, ₹/unit |
|---|---|---|---|---|
| FY2022 | 139.61 | 7,548.98 | 1,465.38 | 0.7900 |
| FY2023 | 687.17 | 10,491.55 | 2,941.58 | 6.3714 |
| FY2024 | 943.91 | 27,410.34 | 11,734.49 | 6.6030 |
| FY2025 | 2,363.82 | 45,028.22 | 21,670.49 | 7.6710 |
| FY2026 | 4,274.07 | 50,993.58 | 25,039.15 | 11.3290 |
Scroll horizontally to read all columns.
Consolidated audited financial figures in ₹ crore; DPU is fiscal-attributable issuer distribution disclosure. FY2022 began operating on 16 December 2021. Later acquisitions change the comparison. Sources: FY2023 report, PDF pp34 and 78–79; FY2024 report, PDF pp81–82; FY2026 report, PDF pp97 and 161–162.
The acquisition dates explain much of the acceleration. Round 3 began tolling on 1 April 2024, Round 4 on 1 April 2025 and Round 5 on 1 April 2026. Financing and concession acquisitions near March year-end can enlarge the balance sheet before contributing a full year of operating revenue. FY2026 portfolio overview, PDF pp16–17
Using the unrounded audited revenues, FY2026’s operating-revenue increase was ₹1,910.26 crore. The new Round 4 project company, NSPPL, contributed reported SPV revenue of ₹1,663.30 crore, approximately 87.1% of the increase. The two existing project companies together grew reported revenue by about 10.45%, to ₹2,610.77 crore. That is evidence of growth in the existing bundle, but tariffs, compensation and other components prevent it from being called organic traffic growth. SPV overview, PDF p17; audited revenue note, PDF p194
That distinction gives the growth story a useful next step. An acquisition can create value if the cash acquired, after its purchase price, financing, additional units and maintenance obligations, improves durable cash per unit. To judge that, we need to carry the revenue story through to the cash available to each unit holder.
The June 2026 presentation continues the expansion: quarterly operating revenue of ₹1,312 crore, against ₹1,023 crore a year earlier, including ₹128 crore from Round 5. The rounded totals imply 28.25% growth. They describe the larger portfolio’s performance, rather than a fixed set of roads experiencing 28.25% more traffic. Quarterly presentation, PDF p12
Keep the Equity and Debt Denominators Visible
At March 2026, ₹50,993.58 crore of consolidated book assets is financed by ₹23,800.55 crore of book equity, ₹25,039.15 crore of carrying borrowings and ₹2,153.87 crore of other liabilities. Thus borrowing/book equity is 1.05× and borrowing/book assets 49.10%. These calculations answer different questions. The components reconcile before rounding; the displayed amounts differ from the total by ₹0.01 crore. Audited balance sheet, PDF p161
The audited regulatory calculation uses a further definition: net borrowing of ₹24,609.46 crore divided by total InvIT asset value of ₹57,373.46 crore, or 42.89%. That asset value includes ₹56,988 crore of SPV enterprise value plus ₹385.46 crore at trust level. For June, the corresponding asset-value bridge is ₹58,245 crore of SPV enterprise value plus ₹359.34 crore at trust level, producing ₹58,604.34 crore. The larger totals are explained by scope. FY2026, Note 67, PDF p214; June results, Note 17, PDF p38
The same distinction appears per unit: March 2026 post-distribution fair NAV was ₹150.47, against book NAV of ₹111.29. Net unit capital after issue costs was ₹26,001.68 crore, also different from book equity. NAV statement, PDF p165; balance sheet, PDF p161
These are different views of the same financing structure, and each earns its place in the analysis. Book equity, net unit capital and appraised net assets carry different assumptions. A fair-value denominator responds to traffic forecasts, maintenance costs and discount rates, so a lower fair-value leverage ratio still needs to be read alongside the cash available for debt service. It does not independently demonstrate stronger debt-service cash.
3. The Distribution Bridge Is More Revealing Than the Yield Headline
NHIT’s FY2026 DPU rose from ₹7.671 to ₹11.329. Its disclosed components are ₹11.221 of interest and ₹0.108 of other income, with zero dividend and zero return of capital. Describing this distribution as mostly capital repayment would misstate the record. Distribution table, PDF p97
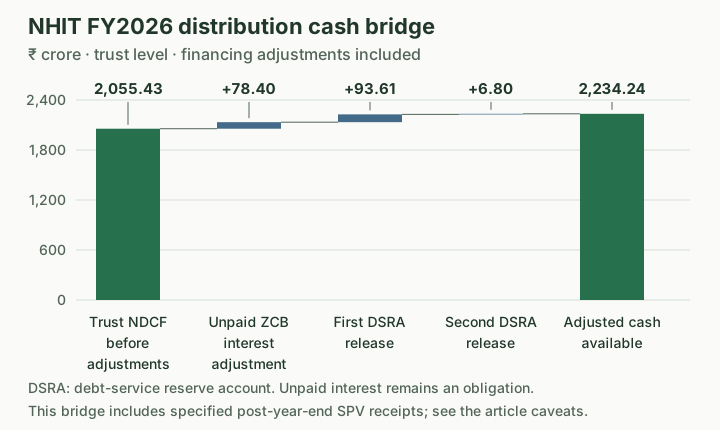
Once the distribution components are clear, the question I want to follow is how much of that cash can recur. The trust’s net distributable cash flow calculation gives us a way to work through it.
| Reported bridge | ₹ crore |
|---|---|
| Trust NDCF before further adjustments | 2,055.43 |
| Add unpaid zero-coupon-bond interest adjustment | 78.40 |
| Add first debt-service-reserve release | 93.61 |
| Add second debt-service-reserve release | 6.80 |
| Adjusted cash available | 2,234.24 |
Unrounded components sum to ₹2,234.2400 crore; displayed components may differ by ₹0.01 crore through rounding. NDCF and reserve notes, PDF pp128–129.
This trust-level distribution calculation includes specified post-year-end SPV receipts before the board meeting; it is not a measure of consolidated operating cash flow generated within the financial year. Changing unit counts also mean that annual DPU multiplied by closing units will not reproduce aggregate distributions.
The three adjustments account for 8.0% of adjusted cash availability. Bank guarantees replaced cash in debt-service reserve accounts, making some previously restricted cash available. The report distinguishes reserves funded from earlier operating cash from ₹49.39 crore originally funded by unit holders and retained for major maintenance. The released amounts should not be casually relabelled repayment of unit-holder capital.
There can be value in freeing cash that no longer needs to sit in a reserve. Following that benefit into future years means keeping its limits in view: a reserve cannot be released repeatedly without first being replenished, and unpaid zero-coupon interest remains an obligation. The guarantee’s costs and conditions, eventual bond payments, maintenance funding and ordinary operating cash each belong in the next cash analysis.
Annual passes introduce another bridge. FY2026 operating revenue includes ₹149.52 crore of annual-pass compensation, of which ₹119.07 crore was received during the year. The ₹30.45 crore gap is an accrual-versus-cash timing observation; it establishes no delinquency. Pure toll collection was ₹4,116.25 crore, below consolidated operating revenue. Revenue and compensation notes, PDF pp194 and 210
The investor-return label matters too. NHIT reports a 20.85% annual NAV-based return, combining an 8.46% distribution yield on opening NAV and 12.39% appraisal-NAV growth. Its adjusted 21.01% reallocates part of the distribution associated with newly issued March units to pre-existing unit holders. Neither is a realised exchange-price return for someone who bought units on a different date. Annual performance disclosure, PDF p97
A concession eventually reaches the end of its term. That makes a lifetime model essential: maintenance, debt amortisation, distributions and remaining value must fit together. The tax character “interest” does not prove that economic capital is preserved, and finite life does not justify changing the issuer’s disclosed distribution components. I would keep returning to cash per unit after the obligations required to keep producing it.
4. Resilience Has to Survive the Corridor Test
The cash model becomes more revealing when we take it back to a particular road. An oil shock can reach a toll road through freight demand, vehicle mix, retail fuel prices, maintenance inputs and financing. Those channels move on different schedules, so the connection deserves a closer look before we draw a conclusion from a national headline.
PPAC’s downloaded August 2026 report places the Indian crude basket at US$90.19 a barrel, against US$82.04 in July and US$69.11 a year earlier: 9.93% month-on-month and 30.50% year-on-year increases. Yet its Delhi IOCL retail series shows diesel at ₹95.20/litre and petrol at ₹102.12 on the listed dates from 25 May through 1 October. May itself included increases. The recent crude rebound cannot simply be assumed to have produced a matching fresh pump-price increase. Crude report, PDF pp5 and 38; retail-price table
Port-linked roads also depend on what moves through the port. NHIT’s Gandhidham–Mundra concession connects the Mundra and Kandla ports. The issuer attributes weaker multi-axle-vehicle movement on that road to West Asia demand and supply disruption. That mechanism can operate even while retail diesel remains unchanged. It is an issuer explanation, not an independently estimated oil-to-traffic relationship. Road description, FY2026 PDF p23; June traffic presentation, PDF p11
| Q1FY2027 observation | Reading the evidence |
|---|---|
| Gandhidham–Mundra: reported PCU traffic −4%; revenue +1% | A traffic measure and revenue can move differently; issuer cites weaker multi-axle movement |
| Palanpur–Abu Road: reported PCU traffic −3% | Issuer cites diversion after an alternative road became free; neighbouring Abu Road–Swaroopganj recorded +1% |
| Muzaffarnagar–Haridwar: reported PCU traffic +37% | About 24% newly counted exempt traffic is cited; the increase cannot be treated as organic growth |
Source: June presentation, PDF pp9–11. PCU means passenger-car-equivalent traffic, not unique vehicles or capacity utilisation. For the NSPPL roads, including Gandhidham–Mundra and Muzaffarnagar–Haridwar, the current period includes ETC and non-ETC traffic while the earlier comparator uses ETC only. That counting break limits even the negative observation’s comparability. The revenue comparison also spans the earlier transition period with fixed remittances; current revenue includes annual-pass compensation and quarterly adjustments. Do not mechanically subtract 24 from 37 to manufacture a comparable growth rate.
The same measurement question follows us back to the national payment data. NPCI’s displayed NETC series excludes annual-pass and Maharashtra EV-exempt transactions. Payment transactions across an expanding network cannot substitute for all journeys on a constant portfolio. Pass adoption changes both what is counted and how a road is compensated. NPCI statistics and footnote
Meanwhile, NHIT reports ₹22,586.54 crore of floating-rate borrowing and a ₹56.47 crore PBT sensitivity to a 25-basis-point rate change, other variables constant. That is the issuer’s accounting sensitivity, not a forecast or an identical change in DPU. Interest-rate risk, PDF p205
Once those mechanisms are visible, it is easier to see what would help the cash hold up. Healthy domestic demand, stable paying-vehicle mix, timely compensation and easing funding costs would strengthen cash generation. Persistent freight disruption, a shift away from heavy vehicles, diversion to competing roads, costlier resurfacing or adverse loan resets would weaken it. Tariff indexation may support nominal receipts, but its contract-specific timing cannot guarantee a complete hedge. Higher discount rates can also reduce appraised values before operating cash changes.
5. The AI Opportunity Is a Better Maintenance Decision
This is where closer observation of the roads could become especially useful. The monitoring programme is substantial enough to take seriously, and its promise lies in connecting what a camera or survey finds with an engineering check and a maintenance decision.
NHAI announced AI-assisted dashcam coverage of about 40,000 km, with weekly surveys and more than 30 anomaly types. A June update said rollout had begun. Separately, the government reports that network survey vehicles can cover up to 300 km a day, with actionable results in 10 days, compared with four to six months previously. These are important claimed process gains. The releases do not establish completed dashcam coverage or a measured financial return. Dashcam announcement; rollout update; survey-vehicle update
The drone framework takes us further along that chain. It sets out survey quality controls, engineer validation, checks against ground conditions and permanent evidence for disputes. Its appended NHAI instructions envisage validation ideally within three days. This is the step that gives an observation practical value: someone has to check the finding and take responsibility for closing it. MoRTH circular and appended NHAI instructions, PDF pp1–6
NHIT’s own procurement brings the same opportunity into the concession portfolio.
| Programme | Verified scope or estimate | Stage supported at the cutoff |
|---|---|---|
| NHAI AI dashcams | About 40,000 km; weekly surveys | Announced scope; rollout initiated |
| NHAI network survey vehicles | Up to 300 km/day; 10-day actionable reporting | Government-reported process performance |
| NHIT traffic management across NWPPL and NEPPL | 433.55 km; 457 TMCS camera units; 46 VIDES units | Tender specifications; some existing equipment separately identified |
| NHIT Bahadarabad free-flow tolling | ₹8 crore estimated capex, excluding GST | Two bidders technically qualified on 30 September; no final award or commissioning verified in the reviewed record |
Scroll horizontally to read all columns.
Sources: the NHAI releases above; ATMS RFP, PDF pp70–73; MLFF RFP, PDF p17; technical qualification notice, p1. Tender quantities and estimated prices are not installed inventory or paid expenditure.
The traffic-management specification includes AI/ML and digital-twin support, alongside performance scoring. These requirements show ambition and contractual intent. They cannot establish that a production digital twin is operating. Similarly, free-flow tolling needs reliable identification, classification, enforcement and settlement; removing barriers alone cannot establish improved collection. ATMS RFP, PDF pp241–245 and 494–495
To see whether these tools improve the road, I would follow an alert all the way to a completed repair. How long did validation take? How long until the issue was closed, and did the defect return? Road condition, lane-hours unavailable and safety outcomes would help complete that picture, alongside capital costs, recurring technology costs and lifecycle maintenance spending.
Following that repair through the accounts can produce a result that initially feels surprising. Better monitoring can initially reduce distributable cash by revealing deterioration and bringing forward necessary repairs. That may improve lifetime asset quality. Falling maintenance expenditure, meanwhile, could reflect deferred work if we lack condition evidence. The improvement I would look for is better service and condition for the resources consumed over the concession’s life.
What Would Change This Assessment?
There is already a credible institutional story here: a large construction programme, lower authority borrowing, a growing concession-financing platform and more systematic asset observation. I would become more confident in the investment case as those achievements connect to the following evidence.
- Public funding: a reconciled series of budget support, recycled receipts, debt service and future commitments, alongside the full annual accounts and CAG material. The later full annual accounts and public audit opinion still need to be obtained and reconciled; failure to locate them in this review does not establish their absence
- Operating growth: same-road traffic by vehicle class, with matched collection and exemption definitions, showing how volumes, tariffs and passes produce revenue
- Cash quality: recurring cash per unit after maintenance and financing, with reserve releases, deferred interest and compensation timing shown separately
- Technology outcomes: accepted deployments and actual expenditure linked to faster repairs, better condition, availability and safety, with meaningful comparison periods
Strong results on those measures would support a more confident view of recurring returns. I would become more cautious with persistent weak traffic after counting adjustments, maintenance deferral, repeated reliance on cash releases or technology spending without operating outcomes. Acquisitions could still create value; they would need to demonstrate it per unit and over time.
India is recycling highway capital at greater scale and developing more systematic ways to inspect the assets. What makes this story worth following is the chance to connect those developments: to see, road by road, how the money invested becomes a maintained service and a sustainable stream of cash. That is where I would look for the next evidence of progress.
Sources and Reproduction
Reading note: Evidence cutoff is 3 October 2026. Financial years end on 31 March; Q1FY2027 means April–June 2026. Amounts are in ₹ crore unless another unit is shown. Financial observations, issuer explanations and analytical inferences are identified separately.
For an optional data view, explore the India Highway Explorer. Its observations may be updated after this article’s cutoff; compare the displayed periods, entities and evidence labels.
Calculated amounts and percentages use the underlying unrounded figures where available; rounded displayed inputs may not reproduce totals or differences exactly. The 87.1% acquisition contribution and 10.45% existing-SPV growth use the annual report’s rounded SPV disclosures. PDF pages are counted from one; NHIT’s annual reports often place two printed pages on each PDF page. Financial tables retain their entity, period and accounting basis. This is research and a cash-flow framework, not an investment recommendation or unit-price forecast.
- NHAI historical accounts: FY2020, PDF p61; FY2022, PDF p91, including FY2021 comparator; FY2023, PDF p87; FY2024, PDF pp74–76, 84–85, 110, 120–121 and 138–139
- NHAI latest and fiscal context: June 2026 results, PDF pp1 and 4–5; FY2026 performance release, 1 April 2026; Union Budget Statement 27A, PDF p302; annuity liabilities, PDF pp2, 8 and 17–18
- NHIT annual financial and distribution history: FY2023, PDF pp34 and 78–79; FY2024, PDF pp81–82; FY2026, PDF pp16–17, 23, 97, 128–129, 138–139, 141, 161–165, 187–194, 205, 210 and 214. NAV return methodology is management disclosure, distinct from audited statement measures
- NHIT latest quarter: June 2026 presentation, PDF pp9–12; 7 August board results, PDF p38, Note 17, for June valuation scope. Quarter accounts are unaudited with limited review; the presentation is issuer commentary
- Fuel and measurement: PPAC August snapshot, PDF pp5 and 38, provisional; PPAC 1 October retail-price table, Delhi IOCL series; NPCI NETC statistics, including exclusions
- Technology: March dashcam announcement; June rollout update; June survey-vehicle update; March drone circular, PDF pp1–6; ATMS RFP issued by NWPPL, PDF pp70–73, 241–245, 494–495; Bahadarabad MLFF RFP, PDF p17; 30 September technical result, p1
Comments